Fitting the exponential distribution
Practical guide on how to fit the exponential distribution to given data on losses
6/8/20245 min read


Fitting an Exponential Distribution to Loss Data: A Short Guide using R
Risk management often requires a set of losses (or other observations) to be fit with a model probability distribution. One of the simplest yet powerful approaches is using the exponential distribution. Modelling using an exponential distribution is also commonly examined in actuarial exams when data is provided to test a student’s knowledge, particularly in regards to checking student's understanding of the importance of modelling tail behaviour.
Modelling losses is a fundamental technique in quantitative risk management and actuarial science, where understanding the tail behavior of losses is crucial for calculating measures like Value-at-Risk (VaR). It can be expanded upon further using Extreme Value Theory to dive deeper into the tail behaviour.
In this post, we'll walk through fitting an exponential distribution to some loss data, examining weekly changes in the German DAX index. Code snippets are provided throughout.
The Data
The EuStockMarkets dataset is built into R and provides data for four major European stock indices from 1991 to 1998. No date stamps are provided, but it is reasonable to expect that weekly index values will be five days apart, although this is an approximation as there are also public holidays to be excluded. It won't have a significant impact on our goals for this analsis.
The Exponential Distribution for Loss Modeling
The exponential distribution is characterised by a single parameter λ (lambda) and has some appealing properties for loss modeling:
Memoryless property: The probability of experiencing a large loss doesn't depend on previous losses. This implies the mean exceedance should be the same as the mean of the population. For example, if the observations follow an exponential distribution and the mean is 5 then the mean of the observations over a chosen level should also be 5.
Simple parameterisation: Only one parameter (λ) to estimate
Analytical tractability: Easy to calculate probabilities and quantiles
Heavy right tail: Can capture some extreme events, though not as heavy as other distributions
The probability density function is: f(x) = λe^(-λx) for x ≥ 0, where λ > 0.
The mean of an exponential distribution is 1/λ, so we can estimate λ as the reciprocal of the sample mean of our loss data.
Data Preparation and Analysis
Once we extract the DAX data (the first column of the EuStockMarkets dataset) it is some basic data manipulation to calculate the weekly log returns using a lag of 5 and then extract the losses.
Notes: Log returns are used as they have some nicer mathematical properties when we are looking at compounding (symmetrical around 0, additivity, naturally handles compounding). When extracting the losses flip the sign as the exponential distribution gives positive values so we are looking at the same side of the axis.
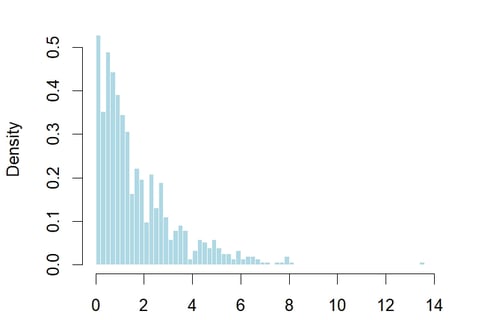
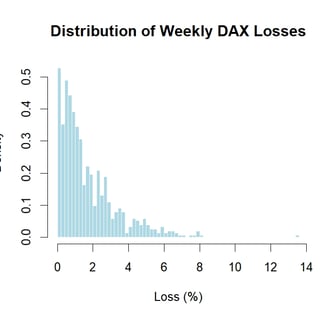
Visualising the data it is clearly right skewed, as you’d expect. Most losses are small with some large losses occurring infrequently.
Fitting the Exponential Distribution
Considering the distribution of losses, an exponential fit looks reasonable. In addition, as the exponential distribution only has one parameter it makes for easy derivation. Lambda can be estimated using the reciprocal of the mean of the sample population.
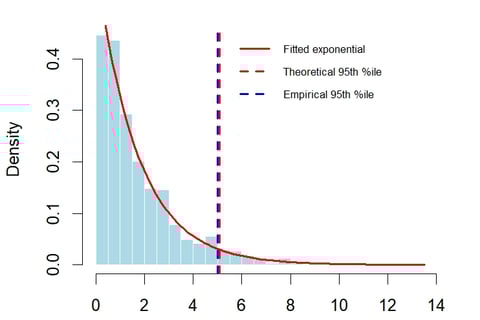
Once lambda is estimated then it is easy to visualise the observed losses with the fitted exponential distribution.
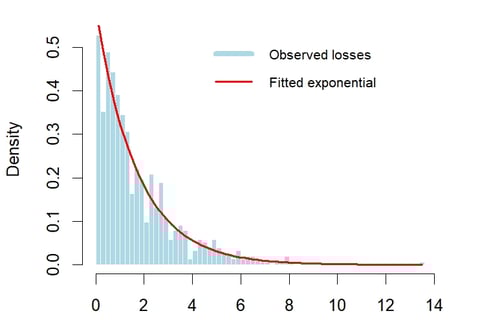
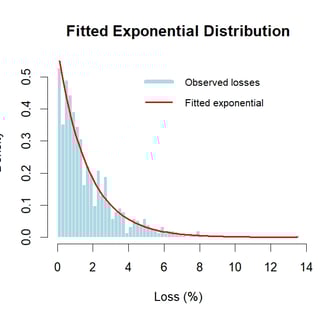
We can see that the exponential fits reasonably well. In some areas the fitted line is below the observation. As the tail is the most important section for risk management it is useful to dig a bit further into the tail and how well it fits the observations.
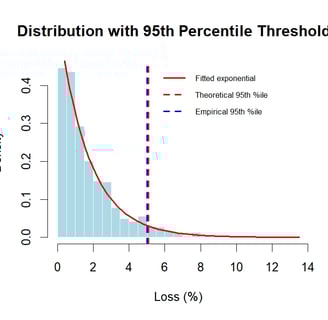
Threshold Analysis: Examining the 95th Percentile
A critical question in risk management is how well our model captures extreme losses as those are the losses that cause the biggest problems and, thinking back to recent financial crashes, the corporate bankruptcies, defaults and financial crashes. As there isn’t a lot of data in the dataset, we’ll work with the 95th percentile, but normally in risk management we might work with the 99th percentile or even 99.9% threshold. However, the dataset used has less than 800 loss datapoints, so there is very little data at the extremes. Whilst the extremes are the most interesting, it’s also where it is most difficult to make proper inferences based on the data as we have the fewest observations.
Evaluating Tail Fit
To evaluate the tail fit we can look at the empirical findings for how many losses exceed our modelled value.
Again, this is a typical point to examine in an actuarial exam as this is where students show their understanding of how to code this in R and also the importance of the tail for evaluating the model and for risk management purposes.
The output shows that 36 out of the 766 observations exceeded the theoretical threshold which is 4.7%. So our distribution fits quite well even in the tail. If anything it is not conservative enough as the threshold is slightly too high.
The overall fit could also be examined further by looking at the Q-Q plot and also from an empirical perspective by examining the largest 10 losses to see how well the model has predicted them by comparing the theoretical probability of such a loss and the empirical probability based on the dataset.
The analysis reveals several important insights:
Model Performance: The exponential distribution provides a reasonable first approximation for DAX losses, particularly for moderate losses. However, some systematic deviations may be noticed.
Tail Behavior: The 95th percentile comparison tells us whether the exponential distribution is conservative or aggressive in estimating extreme losses. If the theoretical threshold is higher than the empirical one, the model might overestimate tail risk; if lower, it might underestimate it.
Risk Management Applications: This fitted distribution can be used to calculate Value-at-Risk (VaR). For example, the 95% VaR would simply be the 95th percentile we calculated: qexp(0.95, rate = lambda_hat).
When Exponential Falls Short: The exponential distribution has an exponentially decaying tail, which might not capture the heavy tails often observed in financial returns. If the Q-Q plot shows systematic curvature, especially in the tails, you might need more sophisticated distributions - Pareto distribution for heavy tails and Generalized Pareto Distribution (GPD) for extreme value modeling
Key Takeaways
Simplicity vs. Accuracy: The exponential distribution offers a good balance of simplicity and reasonable fit for many loss distributions, making it valuable for quick risk assessments.
Parameter Estimation: With only one parameter to estimate, the exponential distribution is less prone to overfitting than more complex models.
Tail Assessment is Critical: Always examine how well your chosen distribution fits the tails, as this is where risk management decisions are made.
Know the Limitations: The exponential distribution assumes a constant hazard rate, which may not hold for financial losses that exhibit clustering or regime changes.
Starting Point for Analysis: This simple approach provides a baseline that can be compared against more sophisticated models.